The fan and the spinning cursor get blamed on each other. On the machines in this studio they are often different problems. A loud fan means the Mac is hot. Slow might be heat too, or it might be swap, a volume with nowhere to write, Spotlight indexing a disk you forgot, or a bad hop to the router that makes every app feel hung.
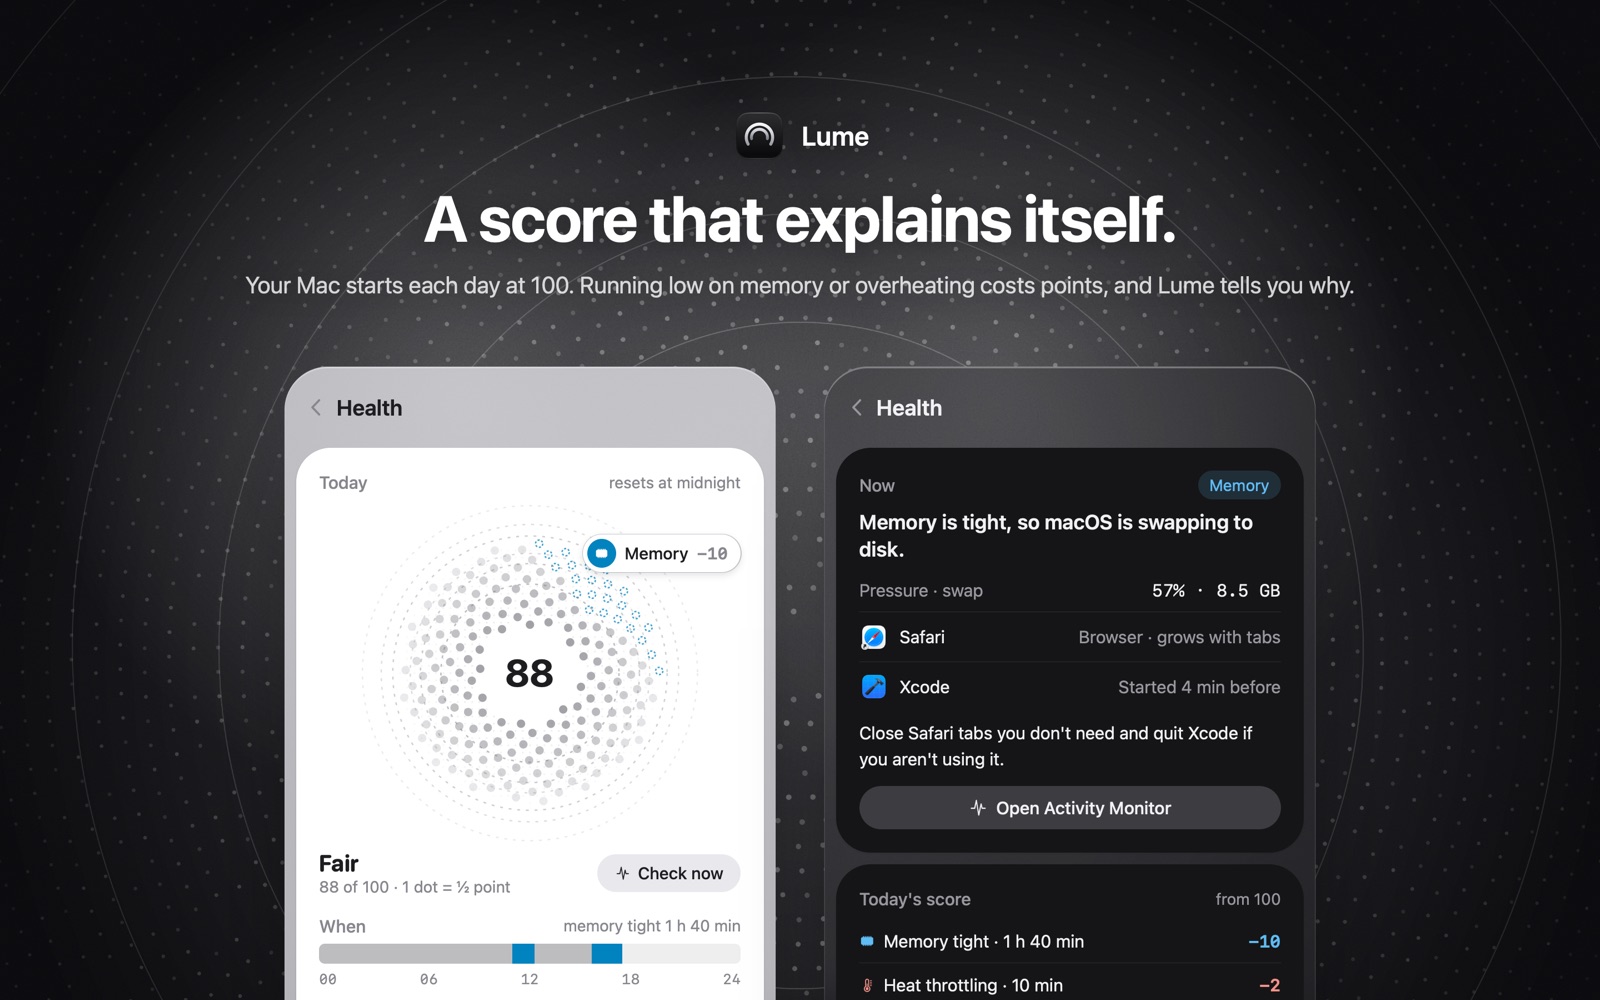
Lume's health score is the second look, after you've noticed and before a "Mac cleaner" gets installed. The day starts at 100. Tight memory, heat, a disk that's nearly full, Low Power Mode, or a slow network take points off, and only if they last a couple of minutes. It resets at midnight. The number is so you notice. The line under it is the part we cared about: which problem, when, and what was likely involved.
If you can hear the fan, start with heat
MacBook Pros and most Intel Macs have a fan. The MacBook Air doesn't. An Air with the same problem gets hot in your hands and then slows down, because the chip throttles with nothing to spin.
Open Activity Monitor, CPU tab, sort by % CPU. If kernel_task is at the top, the machine is usually protecting itself. The kernel holds CPU time back so the chip can cool. Force Quit isn't there, and a malware scan aimed at that name wastes the afternoon. Find the workload: a long compile, a video export, a call on a big external display, a MacBook in a sleeve on a couch.
WindowServer high at the same time means the GPU and the window server are in on it. Lots of windows, a large display, screen sharing, a browser tab running WebGL. Your own app's CPU percentage can look calm while the chassis is hot. Lume keeps GPU load on the processor page for that case: renderer, tiler, and GPU memory, separate from the CPU figure.
The health card records heat throttling. Not fan RPM, and not a temperature in degrees. We didn't build a sensor dashboard. Throttling that lasts more than a couple of minutes takes points off the day. A short burst while Xcode indexes is noise. An afternoon of it is why the score looks bad at 6pm.
Fan-control utilities can pin the fan and change how loud the machine is. They don't tell you which process made it hot. We'd rather you knew the process.
If it's slow and the fan is quiet
Then heat is probably not today's reason. We go in this order, because the earlier checks are the ones that have actually been true here.
Memory pressure. Activity Monitor, Memory tab, graph at the bottom. Green with a scary Memory Used number is cache, and cache is fine. Yellow or red, plus Swap Used climbing, means macOS is using the SSD as extra RAM. The Mac feels sticky in a way the CPU percentage doesn't explain. Lume shows the pressure and the swap. It does not name the app. On our machines that app is almost always a browser, or a simulator left running overnight, and Activity Monitor is where the name shows up. How to read the rows is what's using CPU and memory.
One process actually pinned. Back to the CPU tab. An app you launched is an answer you already have. mds_stores or corespotlightd means Spotlight is indexing. backupd is Time Machine mid-copy. photoanalysisd or mediaanalysisd means Photos is still working through an import. Those finish. A name you don't recognize, stuck at the top for an hour, is worth searching before you force-quit it. Quitting mds feels productive for a minute, then Spotlight starts over.
The disk. Swap and large writes get worse when the volume is nearly full. Lume shows how full Macintosh HD is, external disks included, and how much of the free space is purgeable. Purgeable is snapshots and cache that Finder already counts as available. If almost all of the "free" space is purgeable, the disk can still stall when something wants a few real gigabytes. Delete a thing you understand before you go hunting for a mystery process.
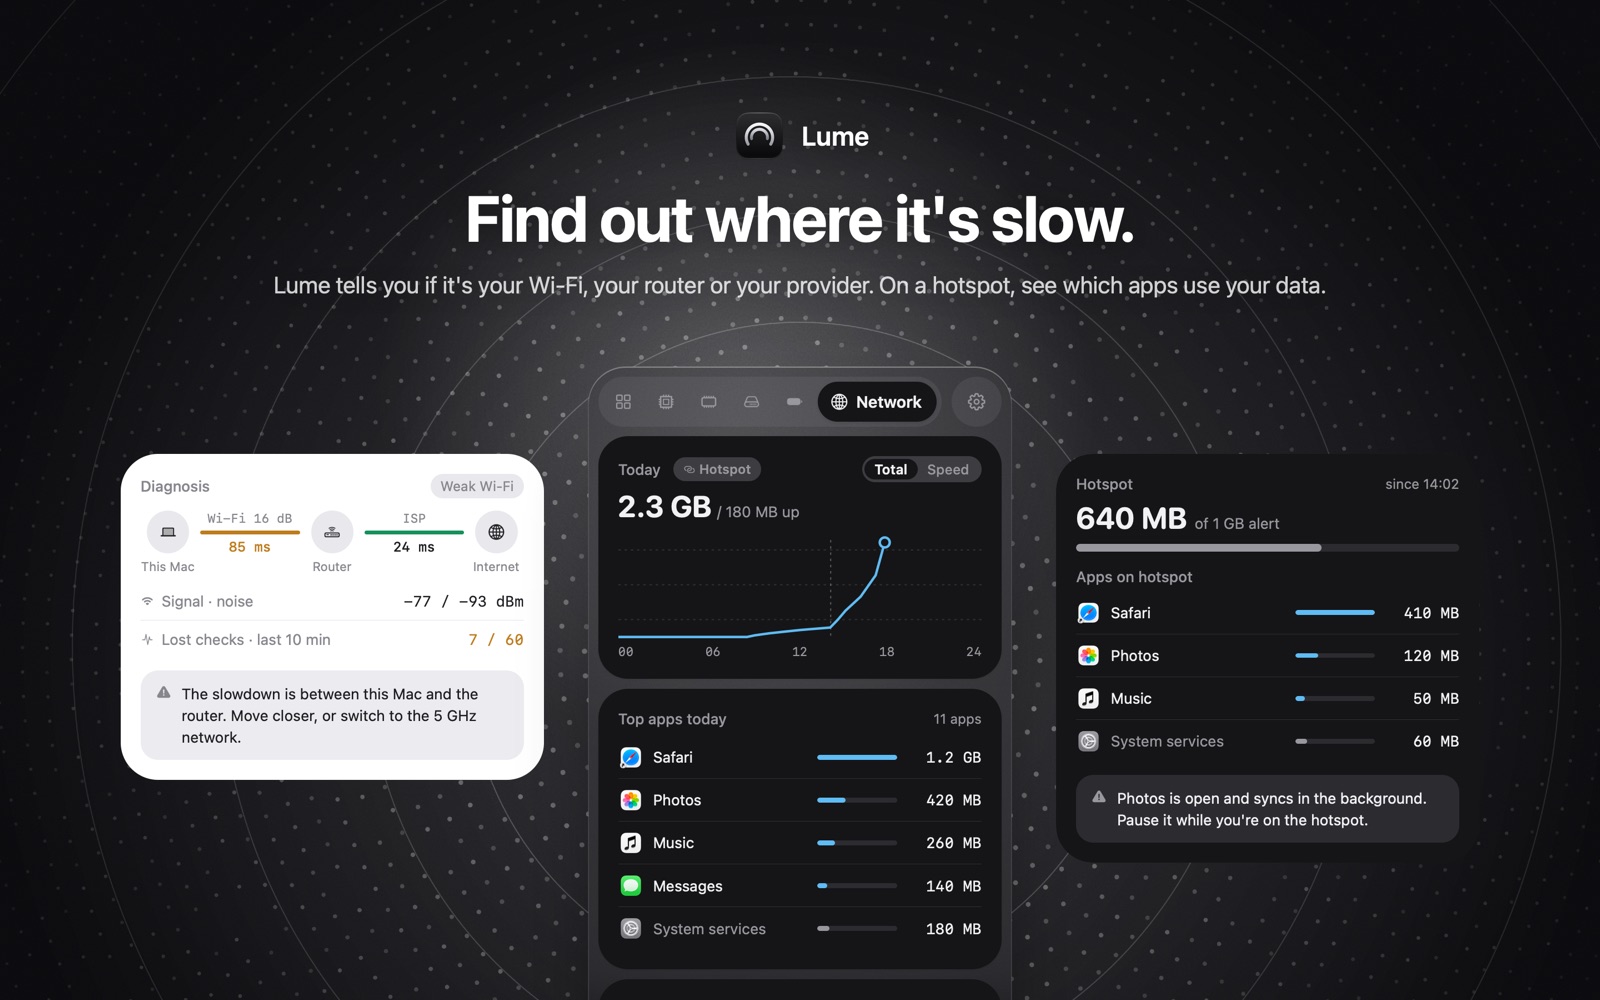
The network, wearing a slow-Mac costume. Mail spins, Safari never settles, git sits on "resolving deltas" longer than the repo deserves. Activity Monitor's Network tab shows bytes. Lume times both hops: Mac to router, and router out to the internet. DNS time is on the same card, and so is how many checks failed in the last ten minutes, so one blip doesn't convict anybody.
If the slow half is between the Mac and the router, it's the local link. On Wi-Fi, Lume shows the signal while the panel is open. Moving closer, or onto the 5 GHz network, is the usual next step. If the Mac-to-router hop is fine and the far hop isn't, the provider is the one having a bad hour. Restarting the Mac does nothing useful in that case. The diagnosis exists so you can tell the two apart before you reboot anything.
Low Power Mode. This one is a setting. The Mac is slower because you, or a low battery, asked it to be. Lume counts Low Power Mode against the day's score so "why is this sluggish" has an answer that isn't a process.
A Mac that was sick overnight
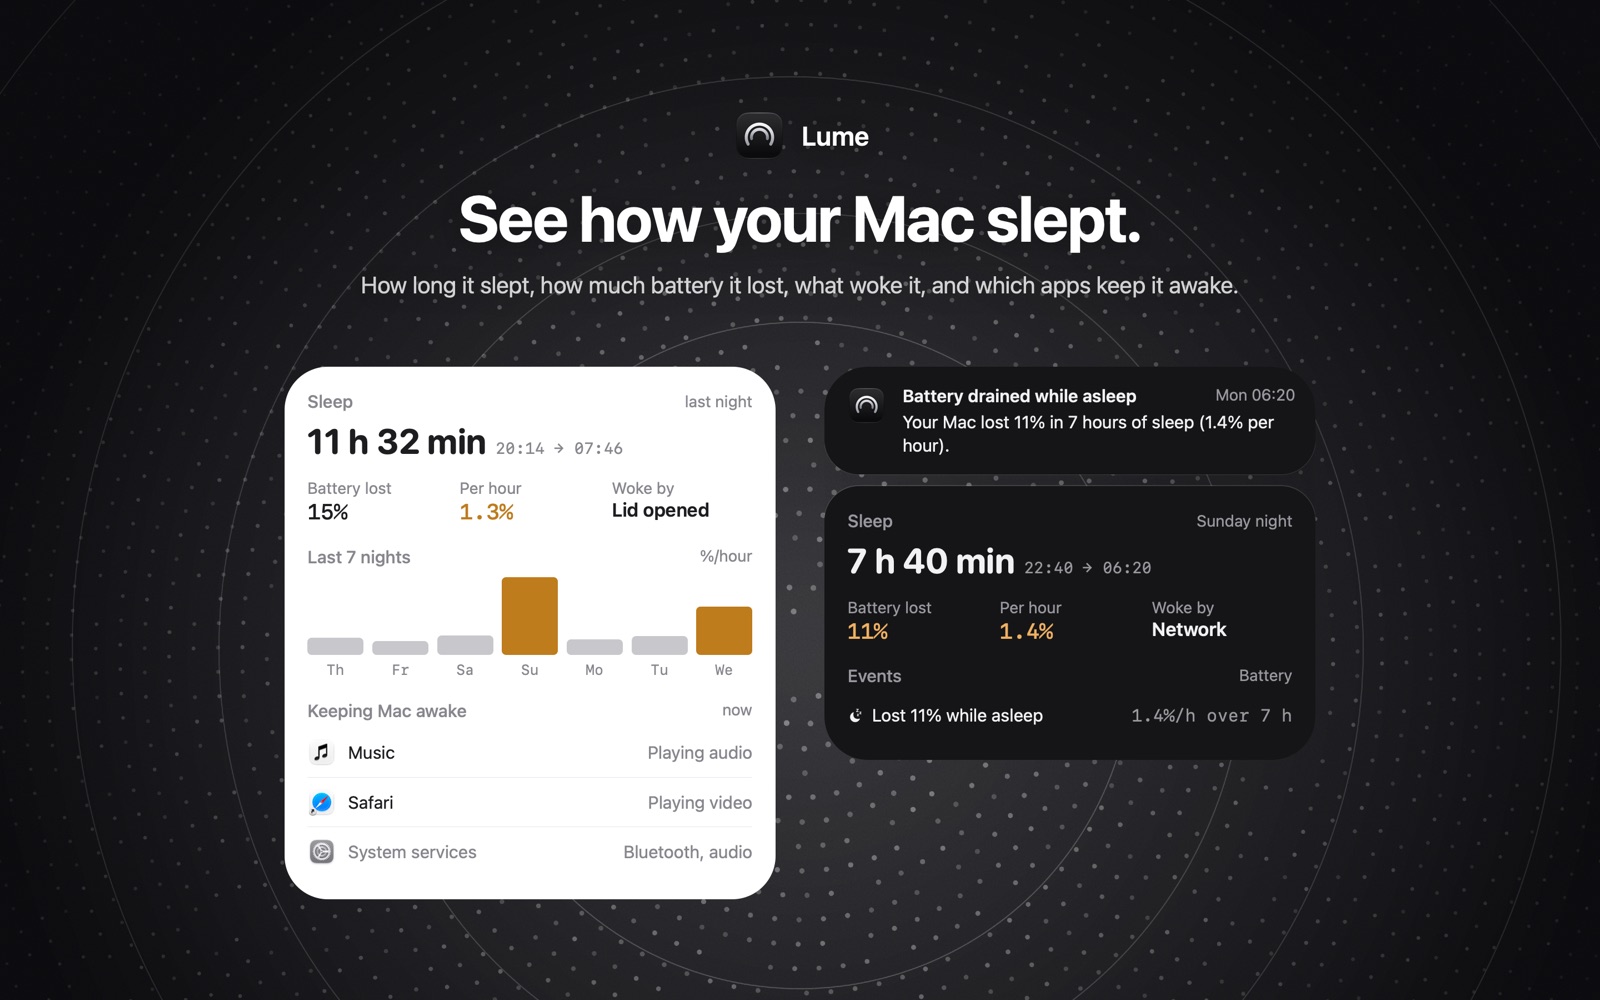
A battery surprise in the morning, or a chassis that's warm at 8am, is often sleep rather than CPU. The sleep report is how long the Mac slept, what percent of battery it lost per hour, what woke it, and which apps are keeping it awake right now.
"Woke by" is concrete. The lid. Or the network. The awake list is concrete too: Music because audio is playing, Safari because a video is, system services because Bluetooth or audio is holding a sleep assertion. A video left running is enough to keep the Mac from sleeping, and the score reports the battery that cost. Pause it before you close the lid.
A couple of minutes is the filter on all of this. Launching an app pins a core. Closing the lid and opening it pins a few more. The score ignores that. It keeps the conditions that stayed. If you want the longer record, which days ran hot, which nights drained, Lume Pro keeps it on the Mac: $9.99 once, Family Sharing. People who paid for Lume before the app was free already have Pro.
Lume 0.2.0 is a free download as of November 9, 2026. macOS 14 or later. No account.
The Lume page is the product. The Mac App Store is the install. The menu-bar-versus-Activity-Monitor argument, for anyone shopping rather than debugging, is the other post.