Every few months someone asks us for an Activity Monitor alternative. We make one, and the honest version of the answer still starts in Apple's Utilities folder.
Activity Monitor is good. The CPU tab sorts processes. The Memory tab, once you trust the pressure graph instead of the scary "Memory Used" total, tells you when the Mac is actually out of RAM. Force Quit lives there. We keep it in the Dock on the machines Lume is built on. Lume cannot list those other apps, and it does not open Activity Monitor for you. Replacing that app was never the point.
What people mean by "alternative" is usually smaller. They want the number visible without a window. They want the menu bar app to cost almost nothing. They don't want a subscription for a CPU percentage. Some of them want fan curves and a temperature for every sensor. Those are three different products. Lume is only the first two.
The heavy part was never the percentage
iStat Menus is the app this search usually means. It's thorough: a lot of sensors, a lot of menu bar items, graphs, history. It also isn't free, and it's more Mac than we wanted resident all day. If you want the full instrument panel, that's the category you're already looking at. We have no interest in competing with it sensor for sensor.
There are free menu bar monitors, including open source ones that put a process list up top. Some are good. The failure mode we kept hitting, including in our own early builds, is the monitor showing up inside Activity Monitor as a thing using the CPU. A menu bar app that idles at several percent has become the problem it was installed to watch.
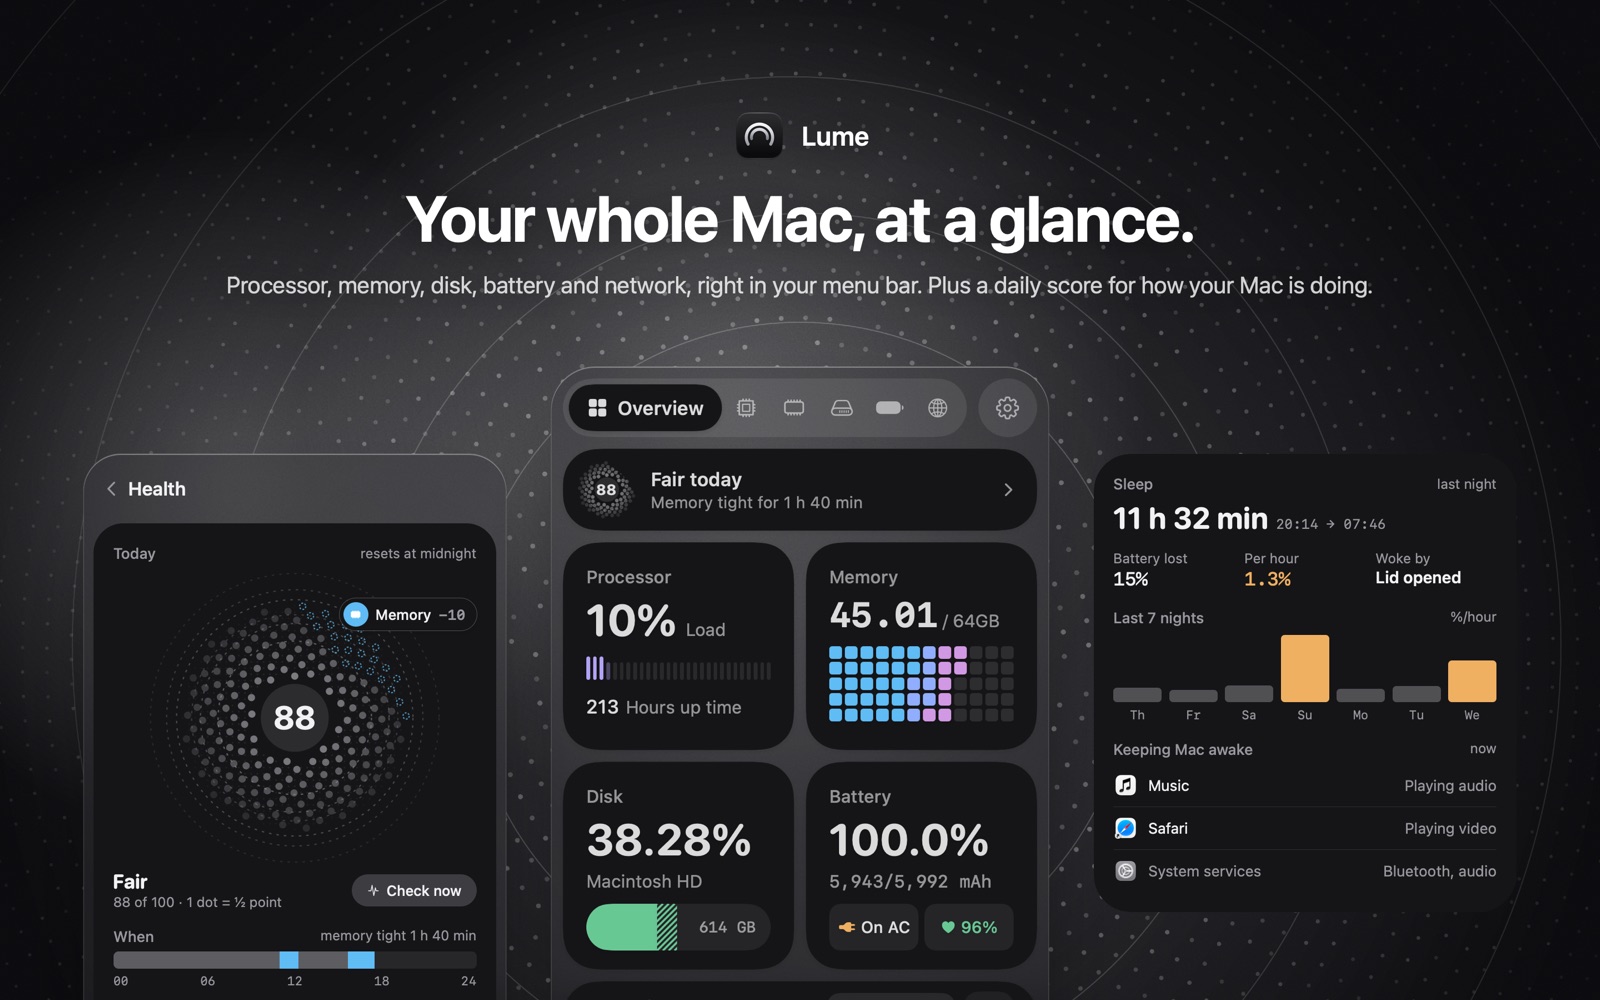
So the constraint on Lume is boring on purpose. You can choose which readings sit in the bar, and the style, so it doesn't turn into a scrolling ticker. Click one of them and the panel opens on that page: processor, memory, disk, battery, or network. The overview is there when you just want the day.
The sentence Activity Monitor doesn't write
A percentage tells you the Mac is busy now. It doesn't tell you that memory was tight for an hour and forty minutes around lunch, or that the chip throttled for ten minutes after that. Lume's health score starts each day at 100. Tight memory, heat throttling, a disk that's nearly full, Low Power Mode, or a slow network take points off, and only when they last a couple of minutes. The card names the condition and when it happened. It does not name the app. For a memory problem you still quit the process in Activity Monitor.
That's the split we live with. Glance and reason in the menu bar. Process list and Force Quit in Activity Monitor. The field guide for the CPU and Memory tabs is what's using CPU and memory on a Mac. The "fan is loud, now what" order is why a Mac is slow, or why the fan is loud.
Two other gaps bothered us enough to build pages for them.
Activity Monitor's Network tab is a byte counter per process. Useful, and it doesn't say whether the slowness is your Wi-Fi, the router, or the provider. Lume times the hop from the Mac to the router and the hop from the router to the internet, shows Wi-Fi signal while the panel is open, and lists how much data each app has used. That per-app count is Lume's own, starting when you install it, not the system's older history. On a hotspot it counts toward a limit you set and tells you which app is spending it. Photos syncing in the background is the classic one.
Sleep is the other. Nothing in Activity Monitor tells you the battery percent lost per hour last night, what woke the Mac, or that Safari is still playing video and holding the machine awake. That's a report in Lume. Audio, a video, Bluetooth: the panel names which one is holding sleep right now.
What we are not going to add
A process list sorted by CPU. You have one. Per-sensor temperatures and a fan curve. That's a different kind of utility, and pinning a fan doesn't tell you which app made the heat. We record heat as throttling on the health score, not as RPM.
We also don't upload the readings. No account. History stays on the Mac. The traffic Lume does generate is dull: a public-IP lookup through ipify when the network changes, and again when you open the panel if the last one is old, plus short timing connections to 1.1.1.1 and 8.8.8.8 so the network check has something to measure. Those timing checks keep running with the panel closed, just less often. If a monitor's privacy policy is longer than that, read it before you leave it running.
Today's numbers, the score, and those alerts are the app. The long run is optional. Lume Pro keeps per-app network use for 30 days, a log of outages, health and memory trends, a battery-wear forecast, a disk-full forecast, and a short note on Mondays. $9.99 once. Family Sharing. Still on the Mac, not on our server. If you bought Lume back when the download cost money, Pro is included. We weren't going to charge those people again when 0.2.0 went free.
"Free" has a date on it
Lume 0.2.0 shipped on November 9, 2026, and the download has been free since that version. It needs macOS 14 or later. There's no ad in it. Pro is the only purchase, and you can ignore Pro forever and still have the menu bar, the score, the network check, and the sleep report.
Install Lume if you want that glance and you're willing to keep Activity Monitor for the moment you need a process name. Skip it if you want fan control, or a second Activity Monitor drawn in the menu bar. We already own the first one.
The product page has the screens. The install is on the Mac App Store.