Activity Monitor stays in the Dock on the Macs we ship Lume from. We still open it. The part we got tired of was opening it to answer a smaller question: is this machine busy, or does it only feel busy?
The process list is for when you already need a name. Lume is the glance, in the menu bar. It cannot see another app's CPU or memory, so that name still comes from Activity Monitor. This is the order we read the numbers in.
The CPU tab is a sort
Spotlight, type Activity Monitor, then the CPU tab. Click the % CPU header. That percentage is a share of one core. On an Apple silicon Mac a single busy thread sits well above 100%, and the counter is telling the truth.
Three names show up often enough that they're worth recognizing before you start force-quitting at random.
kernel_task at the top is usually heat. You can't quit it. On a hot Mac the kernel holds CPU time back so the chip can throttle and cool. Look at whatever was pegged before it, or at the laptop on a cushion, and leave kernel_task alone. A huge kernel_task memory figure is a different symptom, often a flaky hub. Still not something you kill from this tab.
WindowServer composites every window. It climbs with lots of windows, an external display, or screen sharing. A browser can look modest in the list while WindowServer is the process doing the work.
mds_stores is Spotlight. On current macOS, corespotlightd shows up in the same family. After an OS update, a big copy, or a drive you just mounted, they grind and then stop. photoanalysisd does the same thing after a photo import. Give them an evening unless one of them has been at the top for days.
Along the bottom of the CPU window the load splits into User, System, and Idle. User is your apps. System is macOS. High System time with no app to point at is often Spotlight, Time Machine (backupd), or the heat case above.
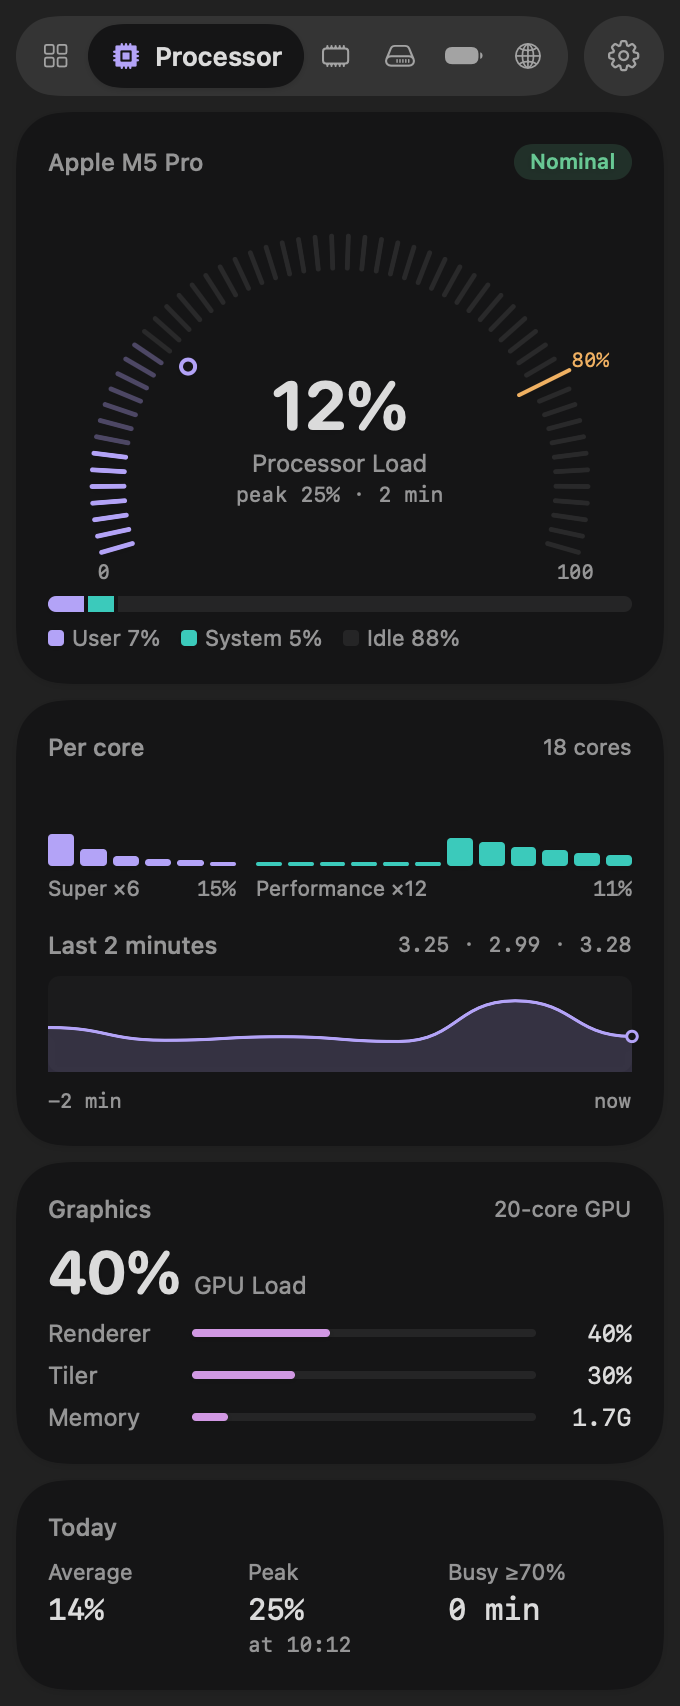
Lume's processor reading is that load, without the process list, left in the menu bar. Click it and the panel opens on the processor page: current load, the last couple of minutes, and the peak. The GPU sits next to that, not inside the CPU percentage. A video export or a large display can heat the Mac while the CPU number looks ordinary. Under the chart, today is an average, a peak, and how long the processor spent busy.
Memory Used is the row that starts arguments
Switch to the Memory tab and a healthy Mac looks broken. Memory Used includes the cache. macOS fills spare RAM with cached files and throws that cache away the moment an app asks for the space. A machine showing most of its RAM "used" can be idle and fine.
The rows that change what you do:
- App Memory is what your apps are holding.
- Wired Memory is what the system will not page out.
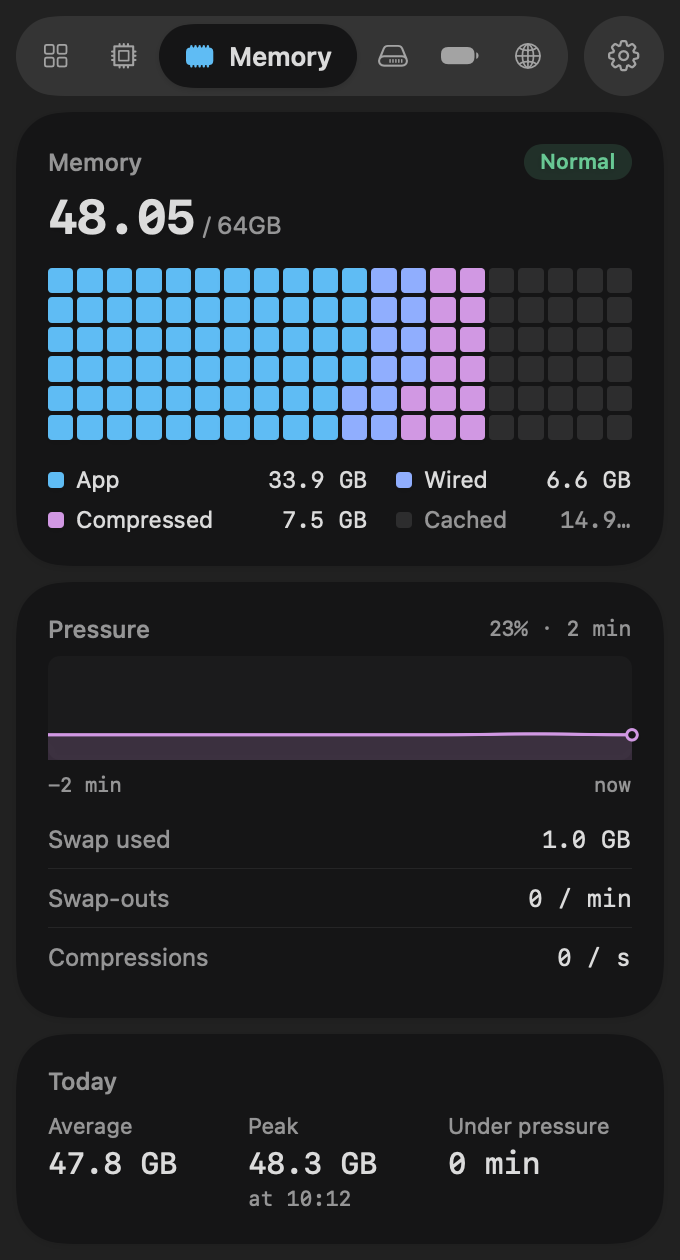
- Compressed is pages squeezed so they don't have to hit the disk yet.
- Cached Files is the disposable pile. Large is normal.
- Swap Used is the one that hurts. That memory was written to the SSD because RAM ran out.
The Memory Pressure graph at the bottom is the summary macOS wants you to trust. Green is fine, including when Memory Used looks enormous. Yellow or red, with swap climbing, means you're out of room.
On our machines the offender is almost always a browser, then whatever was left open from yesterday. Sort the Memory tab by memory and quit that one. Apps that offer to "free RAM" are deleting cache macOS was about to reuse. The cache comes straight back.
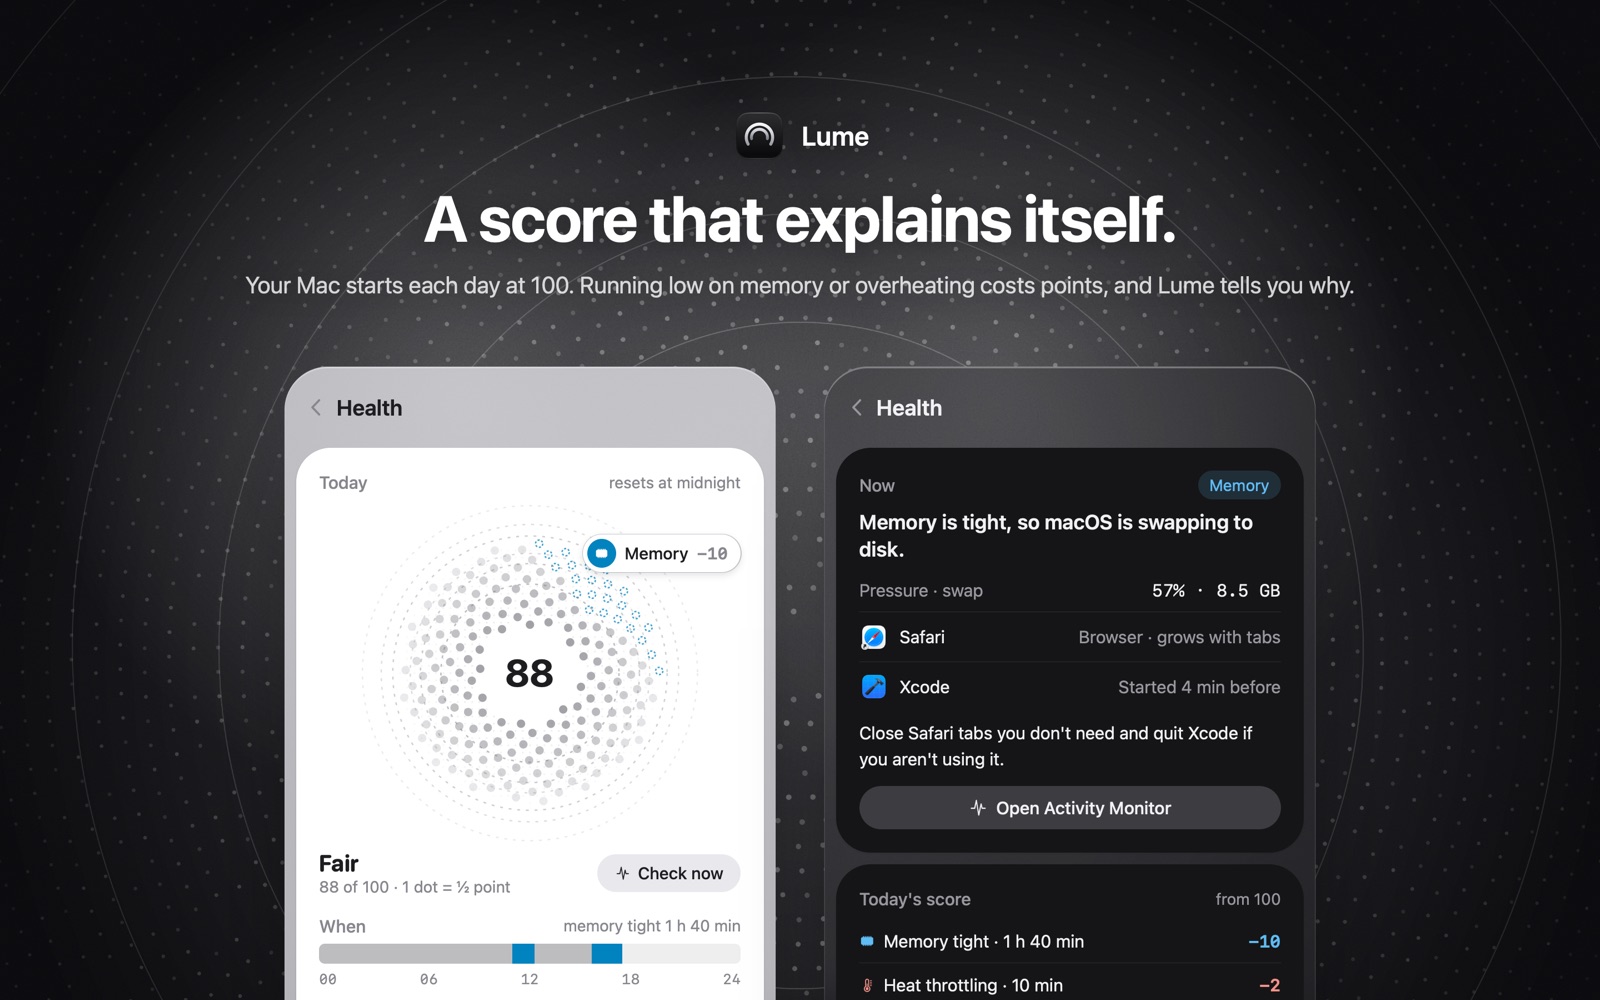
If pressure stays high for more than a couple of minutes, Lume takes points off the day's health score. The memory page shows the pressure and the swap. It does not name the app. Safari grows with tabs, and an IDE left open since yesterday does the same, but the name is in Activity Monitor. You quit the process there.
The score starts at 100 each morning and resets at midnight. A spike while an app launches doesn't count. A browser that sat on yellow pressure all afternoon does.
A full disk looks like a memory problem
Swap has to land somewhere. A nearly full volume makes pressure worse, and writes get sticky. Look at free space before you decide the browser is the whole story.
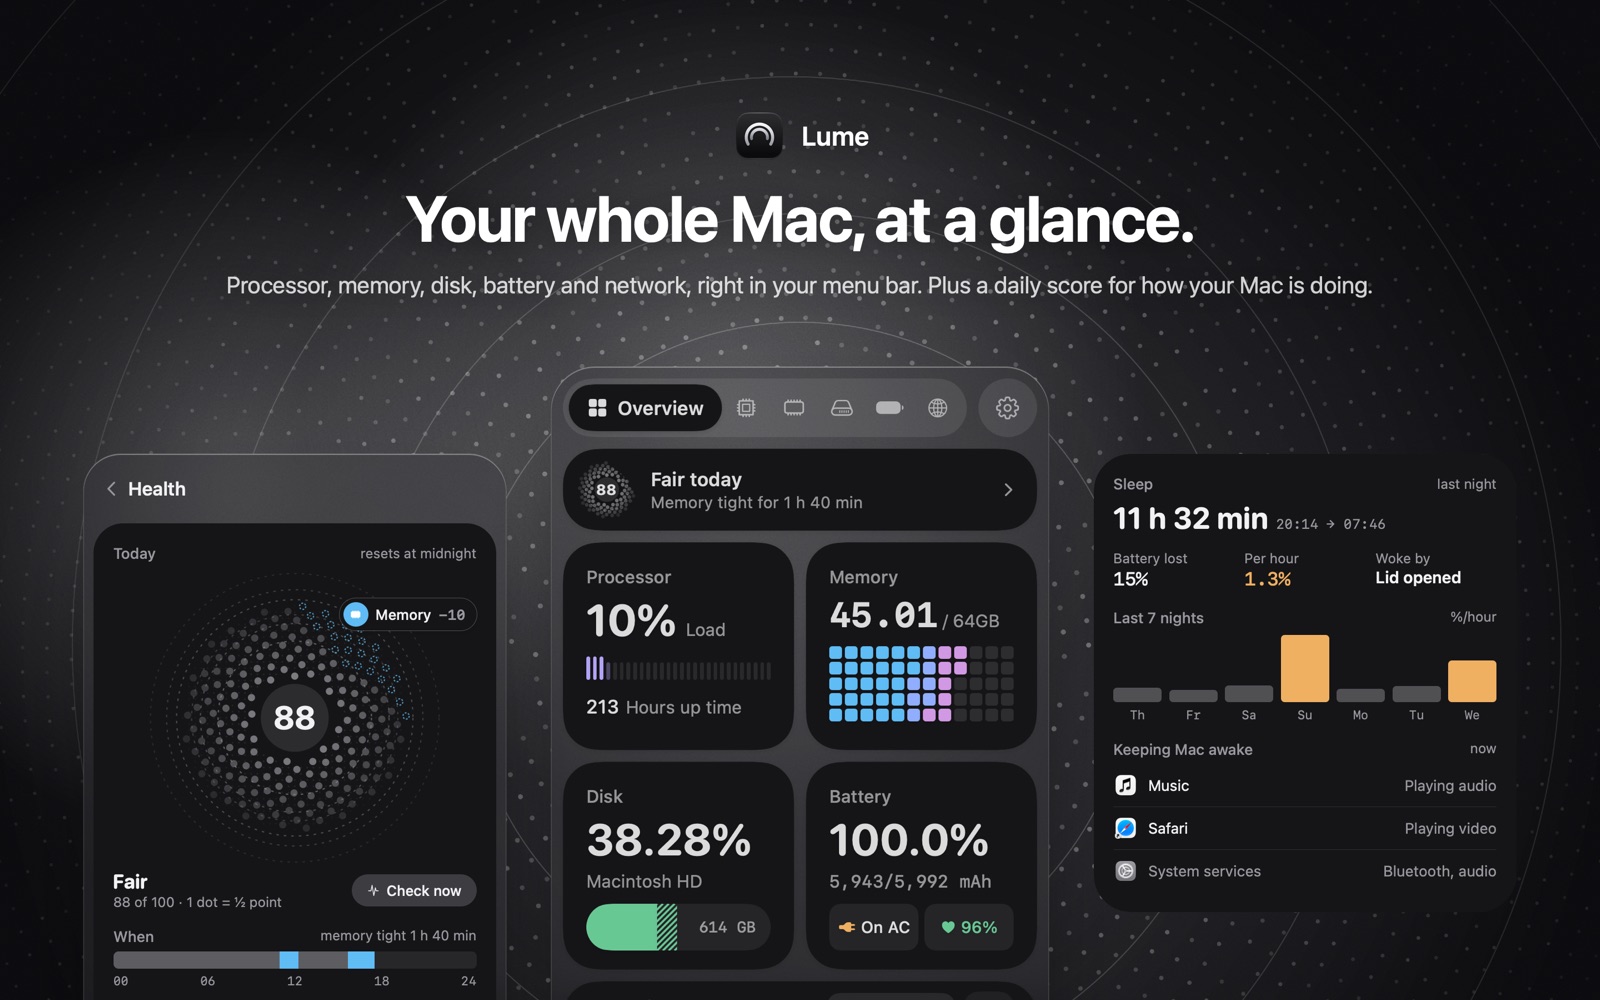
Lume's disk reading shows how full each volume is, external drives included, and how much of the "free" space is purgeable. Purgeable is snapshots and cache. Finder already counts it as available. It becomes available when macOS purges it, which is not always the moment a swap file wants the room. The overview is the short version of the same four numbers: processor, memory, disk, battery.
What we left in Activity Monitor
Force Quit, the Energy tab, and a process list you can sort. Lume would be a worse Activity Monitor, so it doesn't try. You pick which readings sit in the menu bar, so it doesn't turn into a ticker. If the monitor is the thing at the top of the CPU tab, the monitor has failed.
Today's numbers, the score, and the alerts ship with the app. Months of memory history, meaning which days went tight, is Lume Pro: $9.99 once, Family Sharing, stored on the Mac. If you bought Lume before it was free, Pro is already yours.
Version 0.2.0 made the download free on November 9, 2026. Lume needs macOS 14 or later. There's no account, and the history stays on the machine.
More on the app itself is on the Lume page. The download is the Mac App Store listing. When the fan is the actual complaint, or the Mac is slow in a way one percentage doesn't explain, the other note is why a Mac is slow, or why the fan is loud.