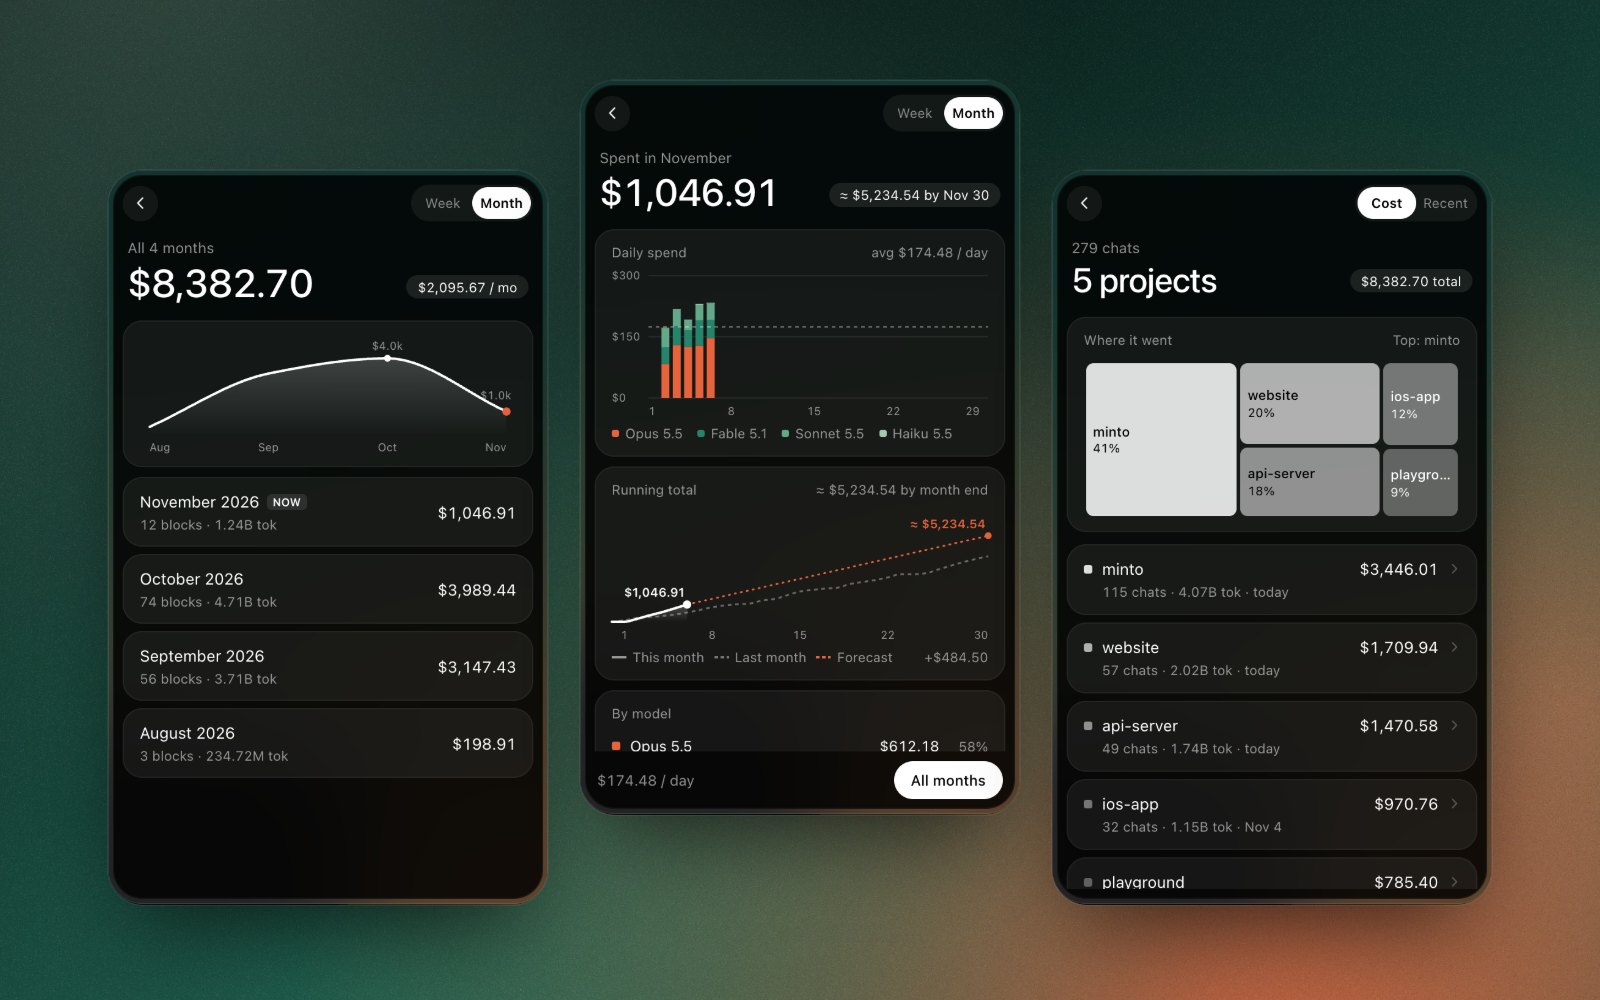
If you are on a flat Claude plan, Anthropic already priced your month. The number you do not have is which repo, and which model, used the session. A token total in a status line does not answer that. Cache reads are not priced like a fresh prompt, so the token count and the dollar figure feel unrelated even when both are right.
Minto reads the logs Claude Code and Codex already write on the Mac and prices them from LiteLLM's public list. The count matches the way ccusage counts, and we test our totals against ccusage's. The result is an estimate. Your plan's billing is the final word. If the panel says two hundred dollars today and your plan is a subscription, you were not charged two hundred dollars today. (If usage credits are on and you went past a limit, that overage is billed at API rates.) You used tokens whose list price is two hundred dollars. That is still the number we want, because it is the only way to compare a heavy afternoon with a light one without pretending the invoice itemizes it.
Cursor is not in those logs. Its requests come from your Cursor account after you sign in, and they don't carry a project folder, so Cursor has no Projects page. The switch at the top of the panel moves between the three. Leave Cursor if you came here for folders.
Today, against the last day you actually worked
The panel opens on spent today. The comparison under it is the last day you used the tool, not yesterday-the-calendar-day if yesterday was empty. A Monday against a zero Sunday is a useless percentage.
Under that, today's running total is drawn against the previous day at the same hour. The forecast line is today's pace extended to midnight. It is a straight "if the rest of the day looks like the day so far," not a model of your habits. Switch to Week and the same chart is the last seven days against the seven before, with no midnight forecast, because the week isn't a pace you should project inside a single afternoon.
Tokens for the day sit with the week and the month under the chart. Week and month are the same estimate, summed. They are not a bill.

The picture is the demo. There is a DEMO badge on the panel for a reason. Opus-this and a four-figure November are not a price list, and they are not our usage. Your models are whatever the log recorded.
Where it went
Breakdown is the week or the month. Daily bars are split by model, with the day's average drawn across them. The running total sits on top of last month's running total at the same point, and on a month view there is a forecast to month end at the current pace. By model is a share of that period: name, dollars, percent. Claude and Codex also get the projects in that period. Cursor skips the project chart, because there is no folder to group.
History is every week and every month, not just the one you're in. Each row is the estimate, the token total, and, where we have them, the number of 5-hour blocks. The average per week or per month is on the header. This is the page that answers "did this get worse," which a single day cannot.
The cover image is that breakdown: the month, the history, and the projects. Same warning. Demo dollars, demo model names.
The folder, then the chat
Projects are the working folders from the log, drawn as blocks sized by what they cost. Open one and the chats are there: a title when the log has one, otherwise untitled, with the estimate, the tokens, and the models used in that chat. Sort the list by cost or by recent. Cost is how you find the repo that became the whole month. Recent is how you find the one you touched yesterday and forgot.
This is the part a terminal summary usually flattens. ccusage can split by project too (ccusage daily --instances), as a table. The treemap is rude about a repo that outspent everything else, in a way a sorted table is not, which is why it sits at the top of the Projects page.
Blocks, if you want the five-hour slice instead of the folder, are covered with the limit clock: when the Claude Code session resets. A block's dollar figure is the same estimate. The percent that stops you is the plan's, and it is not computed from LiteLLM.
What has to be true for the number to mean anything
The logs have to be the ones Minto is reading. Data Folders, in the ⋯ menu, is there when they aren't in the place the scan expects. We don't upload them. There is no Minto account and no tracking. The app goes online to download the price list. Claude Code and Codex spend is read from logs on the Mac. Signing in to Claude only reads the usage percentages.
Prices move when LiteLLM's list moves. A model renamed in the log will show up under the new name, not under whatever we happened to demo. If a total disagrees with ccusage, we treat that as our bug to check, because matching ccusage is the test we run. If a total disagrees with your card statement, the card wins. The panel was never the invoice.
The menu bar can show today's cost without opening any of this. That number is the same estimate, for whichever reading you've selected. The ring beside it, if you turn it on, tracks the 5-hour limit. It is not a dollar. Verified Ultra accounts have no 5-hour limit. For those accounts Minto shows the weekly limit and the weekly Fable limit, the same as Claude's own usage page.
Minto is free. macOS 14 or later. No ads. The page with the rest of the screens is Minto, and the download is the Mac App Store. If you already live in ccusage and want to know what we did and didn't copy, that's ccusage on a Mac.